pandas习题 236:销售额趋势折线图绘制
看过来
《pandas 教程》 持续更新中,提供建议、纠错、催更等加作者微信: gr99123(备注:pandas教程)和关注公众号「盖若」ID: gairuo。跟作者学习,请进入 Python学习课程。欢迎关注作者出版的书籍:《深入浅出Pandas》 和 《Python之光》。
(编码题)给定某电商平台2023年销售数据,要求使用pandas的plot()方法绘制销售额趋势折线图。源数据如下:
import pandas as pd
import matplotlib.pyplot as plt

# 设置中文字体
plt.rcParams['font.sans-serif'] = ['SimHei']
plt.rcParams['axes.unicode_minus'] = False

data = {
    '月份': ['1月', '2月', '3月', '4月', '5月', '6月', '7月', '8月', '9月', '10月', '11月', '12月'],
    '销售额': [120, 85, 150, 130, 180, 200, 220, 250, 280, 300, 450, 380]
}
df = pd.DataFrame(data)
df.set_index('月份', inplace=True)
print(df)
输出结果:
      销售额
月份
1月   120
2月    85
3月   150
4月   130
5月   180
6月   200
7月   220
8月   250
9月   280
10月  300
11月  450
12月  380
具体要求:
- 绘制销售额折线图,标题为"2023年月度销售额趋势"
- 使用蓝色线条,带圆形标记点
- 显示网格线
- 设置Y轴标签为"销售额(万元)"
参考答案
代码如下:
# 创建画布
plt.figure(figsize=(10, 6))

# 绘制折线图
df['销售额'].plot(kind='line', title='2023年月度销售额趋势',
                 color='blue', marker='o', grid=True)

# 设置Y轴标签
plt.ylabel('销售额(万元)')

# 显示图形
plt.tight_layout()
plt.show()
输出结果:

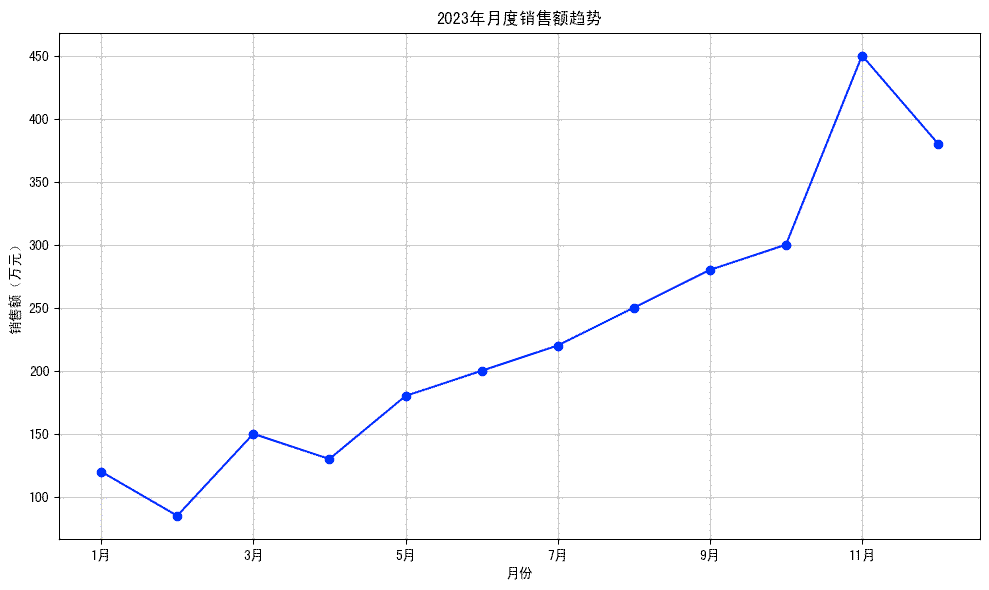
生成一个折线图,显示2023年各月销售额变化趋势:
- X轴:月份(1月到12月)
- Y轴:销售额(万元)
- 蓝色折线带圆形标记点
- 带有网格线
- 标题为"2023年月度销售额趋势"
答案解析
参考代码使用pandas plot()方法实现:
- kind='line':指定绘制折线图类型
- color='blue':设置线条颜色为蓝色
- marker='o':添加圆形数据点标记
- grid=True:显示网格线,便于读数
- title参数:设置图表标题
- plt.ylabel():设置Y轴标签说明
关键技巧:pandas的plot()方法直接基于DataFrame数据绘制,语法简洁,通过设置不同的参数可以快速定制图表样式,适合快速数据可视化分析。
(完)
相关内容
- pandas 练习题 08 2025-09-14 18:49:36
- pandas Plot 绘图参数 2020-11-02 15:49:43
更新时间:2025-09-21 09:59:09 标签:pandas python 折线图


