pandas习题 237:双轴折线图绘制分析
看过来
《pandas 教程》 持续更新中,提供建议、纠错、催更等加作者微信: gr99123(备注:pandas教程)和关注公众号「盖若」ID: gairuo。跟作者学习,请进入 Python学习课程。欢迎关注作者出版的书籍:《深入浅出Pandas》 和 《Python之光》。
(编码题)给定某电商平台2023年运营数据,要求使用pandas的plot()方法绘制用户数与客单价的双轴折线图。源数据如下:
import pandas as pd
import matplotlib.pyplot as plt

# 设置中文字体
plt.rcParams['font.sans-serif'] = ['SimHei']
plt.rcParams['axes.unicode_minus'] = False

data = {
    '月份': ['1月', '2月', '3月', '4月', '5月', '6月', '7月', '8月', '9月', '10月', '11月', '12月'],
    '用户数': [5000, 4200, 5800, 6200, 7500, 8200, 8800, 9200, 9800, 10500, 12800, 11500],
    '客单价': [240, 202, 259, 210, 240, 244, 250, 272, 286, 286, 352, 330]
}
df = pd.DataFrame(data)
df.set_index('月份', inplace=True)
print(df)
输出结果:
      用户数  客单价
月份
1月   5000   240
2月   4200   202
3月   5800   259
4月   6200   210
5月   7500   240
6月   8200   244
7月   8800   250
8月   9200   272
9月   9800   286
10月  10500  286
11月  12800  352
12月  11500  330
具体要求:
- 绘制用户数与客单价的双轴折线图(用户数使用左Y轴,客单价使用右Y轴)
- 用户数用绿色线条和方形标记,客单价用红色线条和三角形标记
- 设置图表标题为"用户数与客单价趋势"
- 分别设置左右Y轴的标签
- 添加图例显示
参考答案
代码如下:
# 创建画布
plt.figure(figsize=(12, 6))

# 创建主Y轴(左轴)
ax1 = plt.gca()
df['用户数'].plot(ax=ax1, kind='line', color='green', marker='s', label='用户数')

# 创建次Y轴(右轴)
ax2 = ax1.twinx()
df['客单价'].plot(ax=ax2, kind='line', color='red', marker='^', label='客单价')

# 设置图表标题和标签
plt.title('用户数与客单价趋势')
ax1.set_ylabel('用户数')
ax2.set_ylabel('客单价(元)')

# 添加图例
ax1.legend(loc='upper left')
ax2.legend(loc='upper right')

# 显示图形
plt.tight_layout()
plt.show()
输出结果:

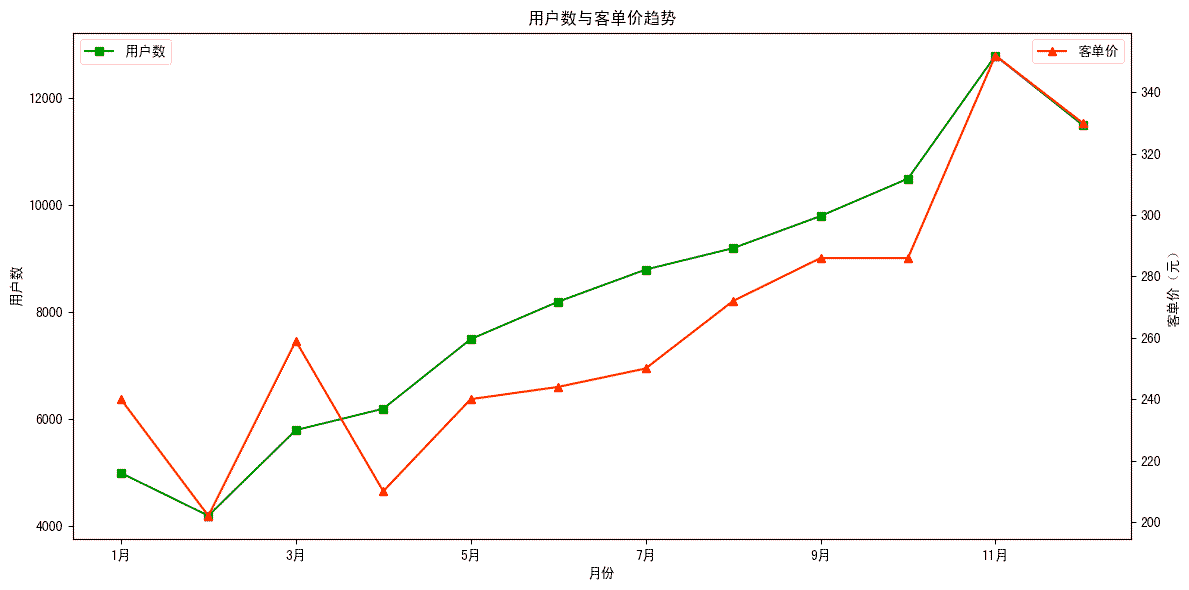
生成一个双Y轴折线图,显示:
- 左Y轴:用户数量(绿色折线带方形标记)
- 右Y轴:客单价(红色折线带三角形标记)
- X轴:月份(1月到12月)
- 标题为"用户数与客单价趋势"
- 左右两侧分别显示图例
答案解析
参考代码使用pandas plot()方法结合matplotlib实现双轴图表:
- ax1 = plt.gca():获取当前坐标轴作为主Y轴
- ax2 = ax1.twinx():创建共享X轴的次Y轴
- 分别在不同坐标轴上绘图:用户数在左轴,客单价在右轴
- 不同颜色和标记:区分两个数据系列
- 分别设置标签和图例:清晰标识不同数据含义
关键技巧:双轴图表适合展示量级不同但有关联的数据,通过twinx()方法实现双Y轴,可以同时观察两个指标的变化趋势和相互关系。
(完)
相关内容
- pandas 练习题 08 2025-09-14 18:49:36
- pandas 折线图 plot.line 2020-06-23 19:02:59
更新时间:2025-09-21 10:03:42 标签:pandas python 折线图 双轴


