Python习题 247:plotly 绘制旭日图
说明
《Python 教程》 持续更新中,提供建议、纠错、催更等加作者微信: gr99123(备注:pandas教程)和关注公众号「盖若」ID: gairuo。跟作者学习,请进入 Python学习课程。欢迎关注作者出版的书籍:《深入浅出Pandas》 和 《Python之光》。
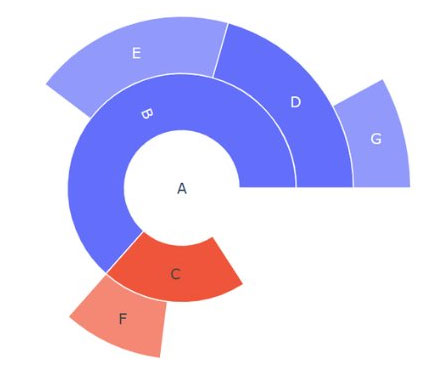
(编码题)旭日图是一种表现层级数据的图表。它以父子层次结构来显示数据,并构成一个同心圆,因此又被成为称为多层饼图。离原点越近,数据的层级越高。换句话说,相邻的两层,内层是外层的“父”。
有以下样本数据,需要用 plotly 绘制旭日图。
# 样本数据
data = {'id': ["A", "B", "С", "D", "E", "F", "G"],
        'parent': ["", "A", "A", "B", "B", "С", "D"],
        'value': [10, 15, 7, 8, 12, 6, 5],
       }
参考答案
代码如下:
import plotly.express as px

# 样本数据
data = {'id': ["A", "B", "С", "D", "E", "F", "G"],
        'parent': ["", "A", "A", "B", "B", "С", "D"],
        'value': [10, 15, 7, 8, 12, 6, 5],
       }

# 创建旭日图
fig = px.sunburst(data,
                  names='id',
                  parents='parent',
                  values='value')

# 设置图表标题
fig. update_layout(title_text="Sunburst Chart")

# 显示图表
fig. show()
输出效果如下:

解析
查看相关链接中的知识。
(完)
相关内容
- Python 可视化习题 2024-09-29 16:49:35
- Python plotly 数据可视化 2024-07-07 08:52:17
更新时间:2024-10-30 14:59:01 标签:python 习题 可视化 旭日图


