Python习题 248:plotly 绘制桑基图
说明
《Python 教程》 持续更新中,提供建议、纠错、催更等加作者微信: gr99123(备注:pandas教程)和关注公众号「盖若」ID: gairuo。跟作者学习,请进入 Python学习课程。欢迎关注作者出版的书籍:《深入浅出Pandas》 和 《Python之光》。
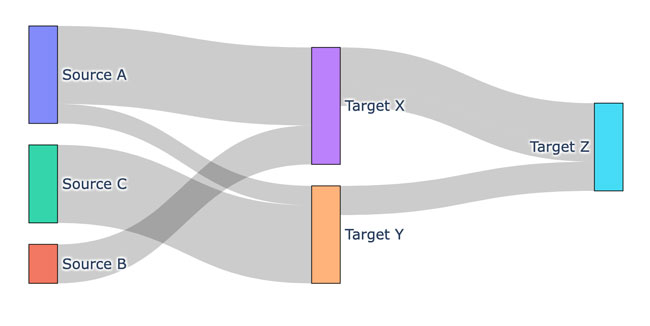
(编码题)有以下样本数据,需要用 plotly 绘制桑基图。
# 样本数据
labels = ["Source A", "Source B", "Source C",
          "Target X", "Target Y", "Target Z"]

source = [0, 1, 0, 2, 3, 3, 4]
target = [3, 3, 4, 4, 5, 5, 5]
values = [8, 4, 2, 8, 4, 2, 3]
参考答案
代码如下:
import plotly.graph_objects as go

labels = ["Source A", "Source B", "Source C",
          "Target X", "Target Y", "Target Z"]

source = [0, 1, 0, 2, 3, 3, 4]
target = [3, 3, 4, 4, 5, 5, 5]
values = [8, 4, 2, 8, 4, 2, 3]

fig = go.Figure(data=[go.Sankey(
     node=dict(pad=15,
               thickness=20,
               line=dict(color="black", width=0.5),
               label=labels
              ),
    link=dict(source=source,
              target=target,
              value=values)
)])

fig.update_layout(title_text="Basic Sankey Diagram",
                  font_size=10)
fig.show()
输出效果如下:

解析
查看相关链接中的知识。
(完)
相关内容
- Python 可视化习题 2024-09-29 16:49:35
- Python plotly 数据可视化 2024-07-07 08:52:17
更新时间:2024-09-29 20:59:57 标签:python 习题 可视化 桑基图


