pandas plot 绘图
看过来
《pandas 教程》 持续更新中,提供建议、纠错、催更等加作者微信: gr99123(备注:pandas教程)和关注公众号「盖若」ID: gairuo。跟作者学习,请进入 Python学习课程。欢迎关注作者出版的书籍:《深入浅出Pandas》 和 《Python之光》。
pandas 提供了 plot() 方法可以快速方便地将 Series 和 DataFrame 中的数据进行可视化, 它是 matplotlib.axes.Axes.plot 的封装。代码执行后会生成一张图片,并直接显示在 notebook 上。
图形类型
plot() 方法的绘制方法可绘制的图形主要有:
- - Plot 绘图参数
- - plot.line 折线图
- - plot.pie 饼图
- - plot.bar 柱状图
- - plot.hist 直方图
- - plot.box 箱形图
- - plot.area 面积图
- - plot.scatter 散点图
- - plot.hexbin 六边形分箱图
基本使用
plot 默认为折线图,折线图也是最常用和最基础的可视化图形,足以满足我们日常 80% 的需求:
df.plot()
s.plot()
我们可以在 plot 后增加调用来使用其他的图形,当然这些图形对数据结构也有自己的要求,教程后边会逐个介绍:
df.plot.line() # 折线的全写方式
df.plot.bar() # 柱状图
df.plot.barh() # 横向柱状图 (条形图)
df.plot.hist() # 直方图
df.plot.box() # 箱形图
df.plot.kde() # 核密度估计图
df.plot.density() # 同 df.plot.kde()
df.plot.area() # 面积图
df.plot.pie() # 饼图
df.plot.scatter() # 散点图
df.plot.hexbin() # 六边形箱体图,或简称六边形图
使用方法
Series 使用
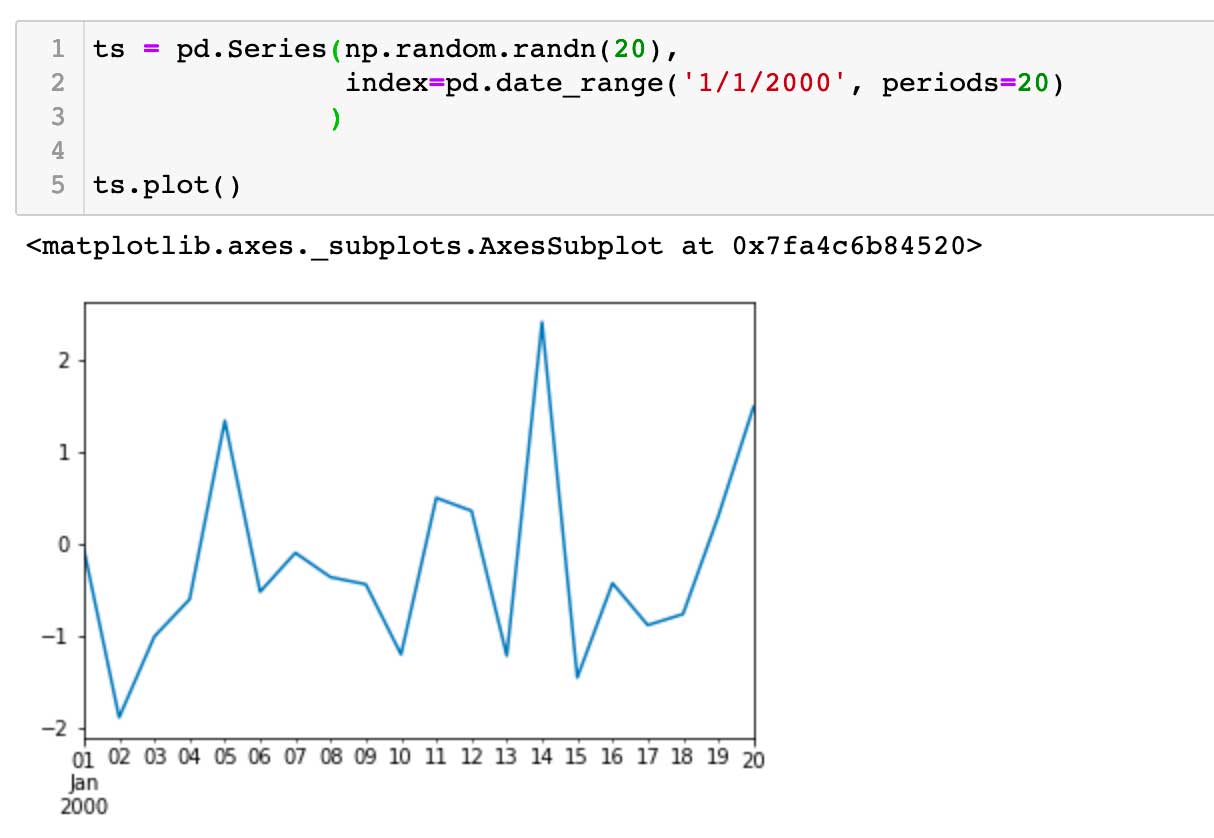
Series 使用 plot 时 x 轴为索引,y 轴为索引对应的具体值:
ts = pd.Series(np.random.randn(20),
               index=pd.date_range('1/1/2000', periods=20)
              )

ts.plot()

# <matplotlib.axes._subplots.AxesSubplot at 0x7fa4c67035e0>
# 会显示一张折线图

DataFrame 使用
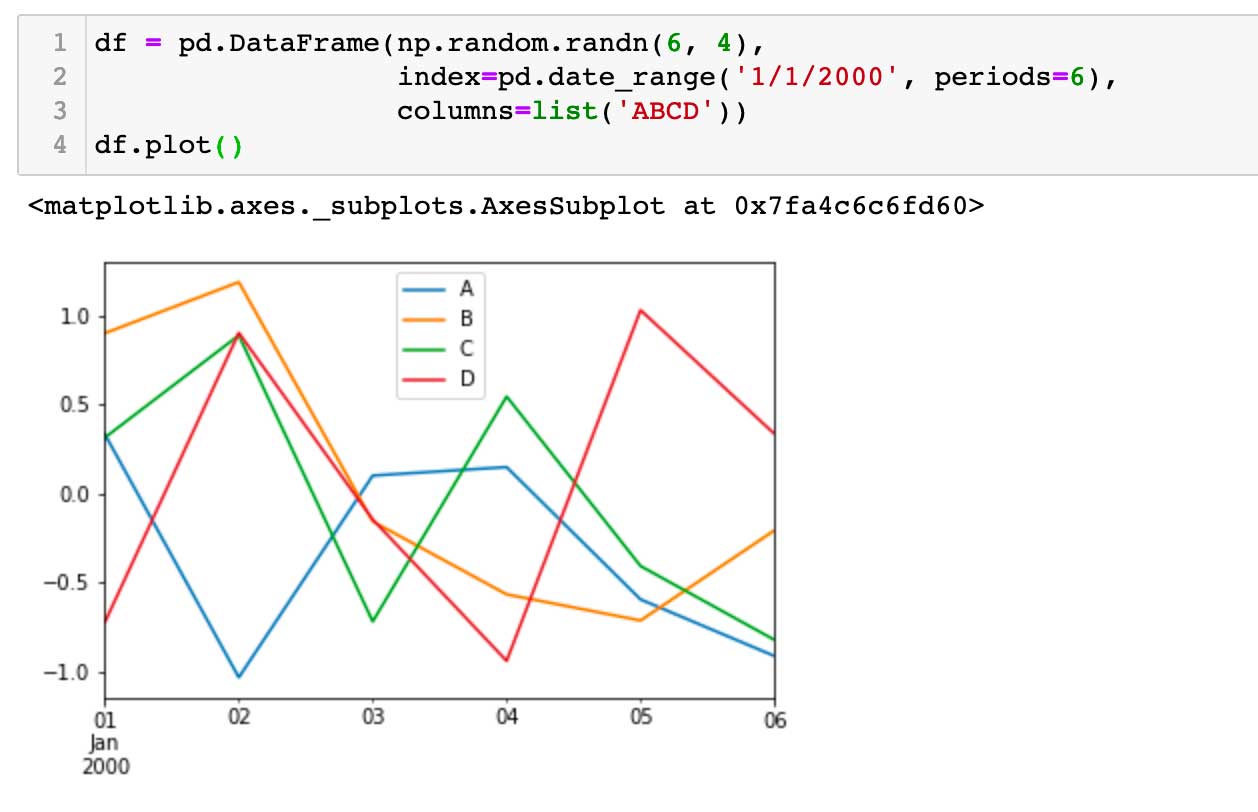
DataFrame 使用 plot 时 x 轴为索引,y 轴为索引对应的多个具体值:
df = pd.DataFrame(np.random.randn(6, 4),
                  index=pd.date_range('1/1/2000', periods=6),
                  columns=list('ABCD'))
df.plot()
# <matplotlib.axes._subplots.AxesSubplot at 0x7fa4c699b490>
# 会显示折线图

指定列
DataFrame 在绘图时可以指定 x 和 y 轴的列:
df3 = pd.DataFrame(np.random.randn(1000, 2), columns=['B', 'C']).cumsum()
df3['A'] = pd.Series(list(range(len(df))))
df3.plot(x='A', y='B') # 指定 x 和 y 轴内容

如果 y 轴需要多个值,可以传入列表:
df3.plot(x='A', y=['B','C'])
两种图形叠加
可以实现折线和柱状图等叠加效果:
ax = df.b.plot(kind='bar', color='#f28855')
ax = df.b.plot(kind='line', color='blue')
ax.legend(['B1', 'B2']) # 图例
以上代码在 jupyter notebook 上显示叠加的图形。
相关内容
- pandas 爬取 LPR 数据并可视化 2024-11-05 15:04:19
更新时间:2022-05-15 21:57:35 标签:pandas 可视化 绘图


